PhD Thesis
This algorithm was developed during the course of my PhD thesis project. An electronic version of my thesis can be found in the VUW Research Archive.
Sub-sampling analysis script
The custom R code used to carry out bootstrap sub-sampling analysis can be found here. To reduce loading time, the best/worst ranking can be calculated initially in the shell:
Report best/worst rank for each marker
x=bootstrap100_PP_males_anzgene_plink100_Aus_NZ.csv; pv ${x} | sort -t',' -k 2,2n -k 3,3rn | perl -F',' -lane 'if($run != $F[1]){$run = $F[1]; $rank=1; $lastVal=0; $lastRank=0} if($F[1] ne "bs.run"){$nextVal = $F[2]; $F[2] = ($F[2] == $lastVal) ? $lastRank : $rank; $lastRank = $F[2]; $lastVal = $nextVal; $rank++} print join(",",@F)' | sort -t',' -k 1,1 -k 3,3n | ~/scripts/quantile_subset.pl | gzip > maxminRank_${x}.gz;
Shell script explanation:
- Sort by bootstrap sub-sample then by calculated statistic in reverse numerical order
- Convert statistics to ranks, allowing ties
- Sort by marker, then by rank
- Preserve maximum and minimum ranks for each marker
Result graphing
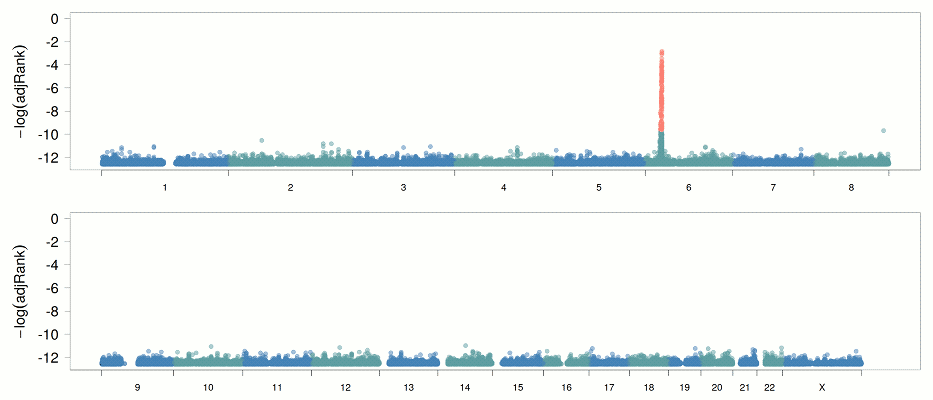
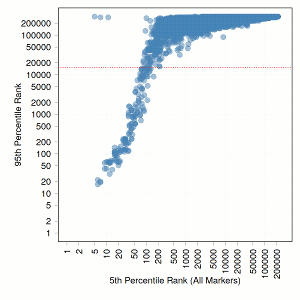
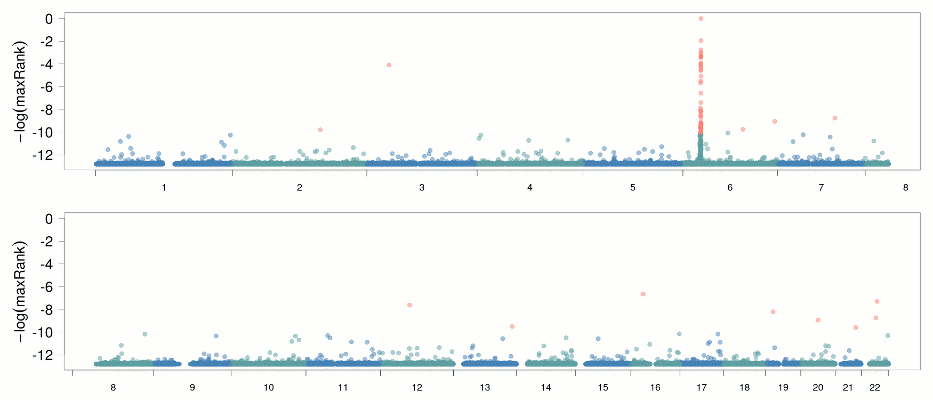
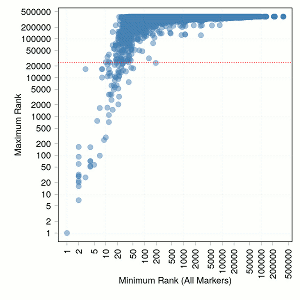
The custom R code used to generate graphs for the poster can be found here. Two paths for generating a common intermediate data structure are provided in the code: one which loads directly the bootstrap script output and carries out ranking by R code, and another that uses the intermediate output files by the shell commands shown above.
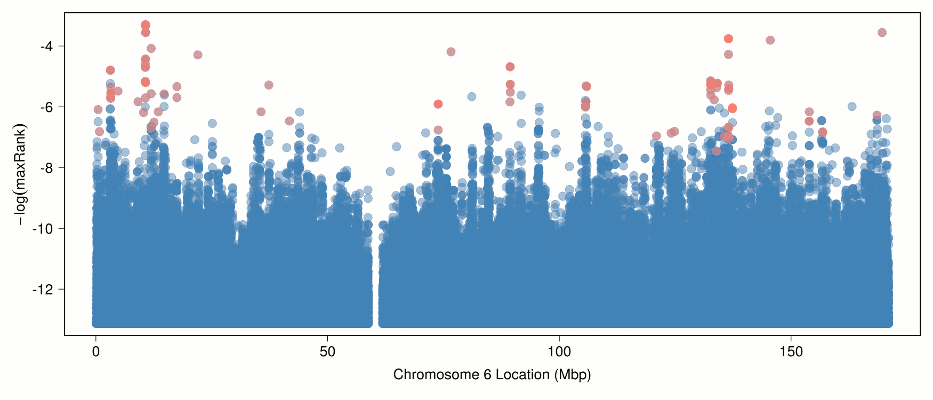
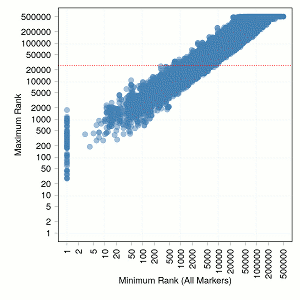
Type 1 Diabetes
1000 Genomes, Chromosome 6 Subset
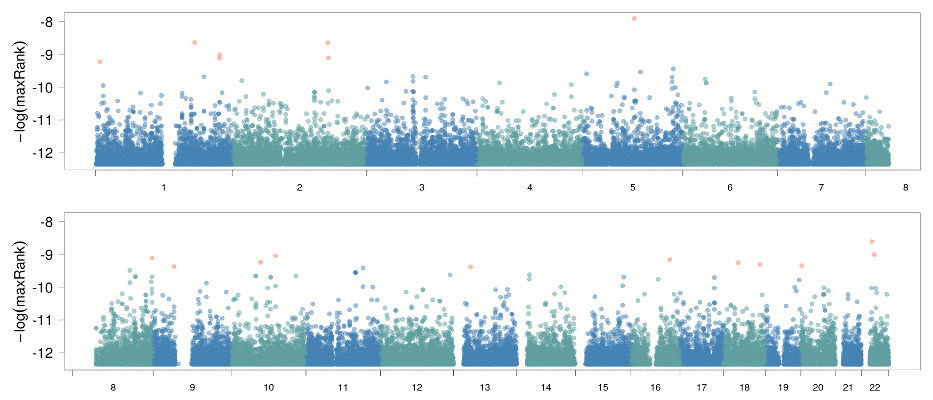
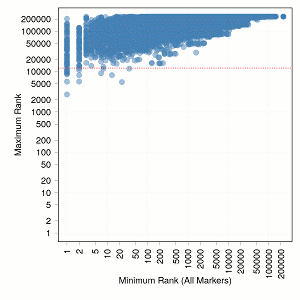
Parkinson's Disease
Multiple Sclerosis (not on poster)
